Community Heat Mapping
* Update *
The Boulder Community Heat Mapping event took place on July 22nd, 2022. Thank you to all the incredible volunteers who collected the data and made this event possible!
We are expecting the data back in 6-8 weeks so stay tuned for that announcement. See below for details about the event.
This summer, as a part of the recently launched Cool Boulder Campaign, the City of Boulder partnered with NOAA and community scientists to map the hottest parts of our city.
DATA TO DRIVE OUR NATURAL CLIMATE SOLUTIONS PLANNING
As the past year has vividly demonstrated, global warming and the associated climate changes are significantly increasing the potential for not only extreme—sometimes deadly—heat, but also wildfires, drought, and extreme winds.
Extreme heat, however, kills more Americans than any other weather event, but not everyone’s risk is the same. Denser urban areas, which typically have a lot of dark surfaces that absorb and hold heat, are much hotter than their surrounding rural and suburban counterparts. This is known as the “urban heat island effect.” Zooming in further, heat is not distributed evenly within these urban heat islands. Oftentimes the effect disproportionately affects marginalized communities.
In order to make our natural climate solutions work as impactful as possible, we need to locate projects in the areas where they are most needed. Earlier this year, the National Oceanic and Atmospheric Administration (NOAA) announced the next cohort of over a dozen cities across the city participating in a groundbreaking urban heat mapping initiative. Boulder has been selected as one of 14 cities to participate in this international project. The data will be collected by temperature sensors. These sensors will be carried by volunteers moving through different assigned parts of Boulder and collecting temperature data.
The City is also working with NASA’s Jet Propulsion Lab (JPL), the CU Earth Lab, researchers from the Department of Ecology and Evolutionary Biology at CU Boulder, and others to integrate the community-gathered temperature data with data gathered from a network for over 50 stationary sensor stations. This will create one of the most comprehensive urban heat maps ever constructed.
Finally, this information will then be integrated into sophisticated heat management models developed by Georgia Tech’s Urban Climate Lab to help design urban forestry expansion strategies and other nature-based climate solutions efforts that target our City’s most vulnerable areas/communities.

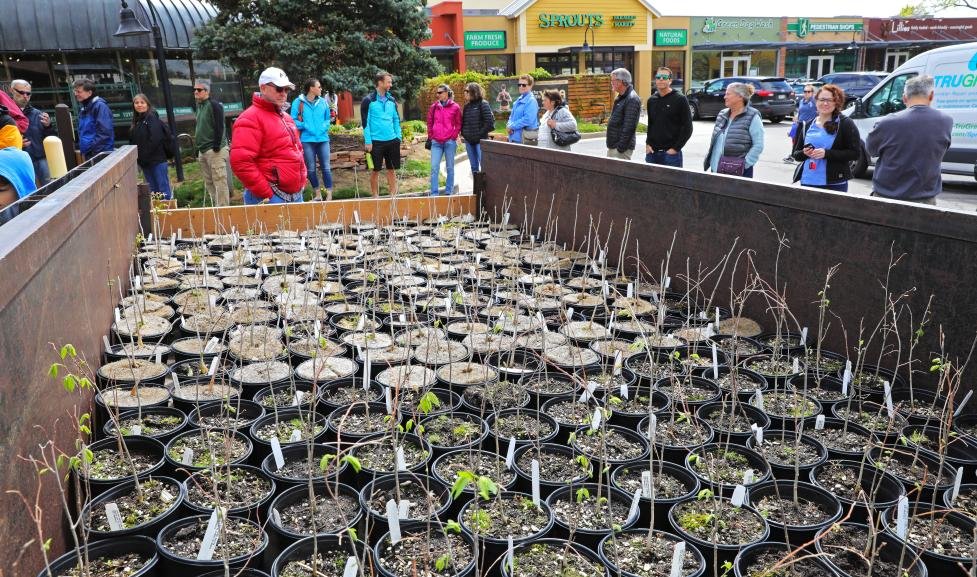
Some images from the event

Photo credit: Danielle Furuichi

Photo Credit: Shannon Keane

Photo Credit: Shannon Keane
See us in the news!


Community Scientists Team
We recruited 100 community members to volunteer with the data collection phase of this project. We hope that more than 100 folks will want to be involved with this critical effort, and will find ways for additional teams to participate.
With help from NOAA, the City designed the routes for volunteers and provide any assistance needed to set up the sensors in each vehicle. Each car will had a driver, a navigator, and a backup volunteer. We acquired sensors that can be carried by bicyclists or pedestrians as well.
Volunteer Time Commitments & Training
Requirements for Drivers*
*There are also navigator roles, which do not have these requirements.
Valid driver’s license
Auto-insurance
Access to a vehicle
Time Commitment
Based on previous campaigns, volunteers will spend a total of about 4 to 6 hours, though the majority of time (~3.5 hours) will occur on the selected campaign day. This will potentially be less if your team hands off equipment to another team for a later shift.
Training and Orientation
Volunteers will need to attend a one-hour Volunteer Training Session, complete a short knowledge quiz, and sign a Liability Waiver.